

Team Report
This is where you can see the team activity and analyze the performance of the team as a whole. From here, you can also view the leaderboard and drill further down into individual users of the team for a deeper analysis.
This shows you how many responses were written during the selected reporting period. How many tickets were resolved during this time and how many of those were resolved in the first response. Optimizing for first response resolutions not only boost your team's efficiency in solving problems but also makes the experience better for your customers.
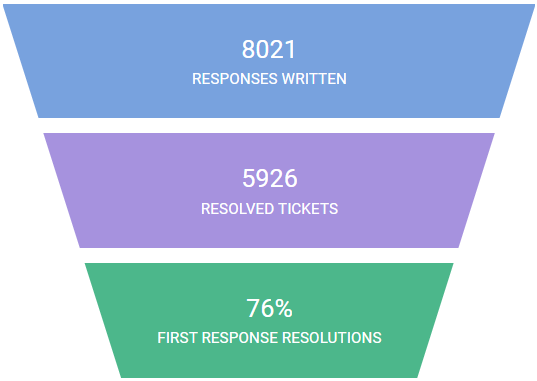
Note: A ticket is considered "resolved" if it was closed after a user responded to the customer and was not re-opened after that. The first-response resolution represents the percentage of how many of those resolutions were on the first response to the customer.
This is your team's leaderboard. By default all the users are shown but this can be filtered to specific inboxes using the report filters. Each row represents the following information about a user:
- Name: User name
- Happiness Ratings: percentages of Great, Okay and Not Good ratings received during this time
- Responses: number of responses and comparison from the last period
- Resolved: number of tickets resolved, and comparison from the last period
- First Response Resolutions: percentage of resolutions that were on the first response, and comparison to the last period
- Response Time: Average response time and comparison to the last period
- Activity: line chart of activity over time
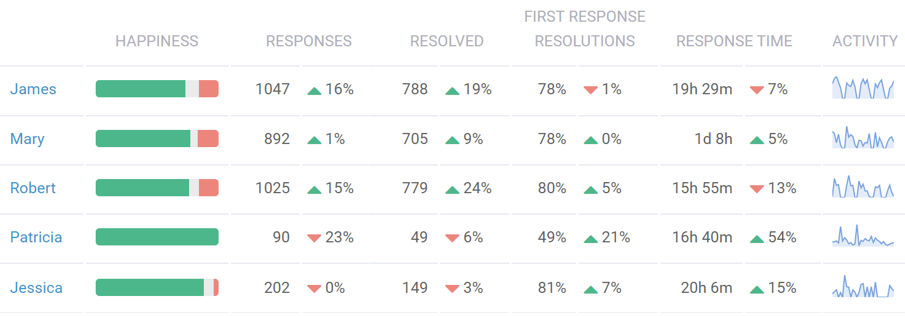
Pro Tip: Click on a user name to view the performance report for that specific user.