Performance Report
This report gives you details about how your teams are performing and how productive they are in resolving the customers' issues. It answers questions like how many customers are you helping every week, how fast are you able to help them, and how efficient are your responses. Just like others, this report runs on the selected reporting period.
One of the huge benefits of this report is that it gives you and your team full accountability of the work being done. You can drill down to see each user's performance report and their contributions.
Before we start looking at the different sections of the report, let's understand what are these metrics and how the system calculates them.
Response: A response occurs when a user sends a reply to an inbound customer message. A ticket can have multiple responses, each representing a back-n-forth between the customer and the user.
Response Time: The average time between an incoming message and an outbound response to a customer.
First Response Time: The time between the first inbound customer message on a ticket and the outbound user response.
Closed Ticket: A ticket was closed during the reporting period.
Resolved Ticket: If a ticket has any responses when it's closed, it's considered resolved by the user that wrote the last response. A ticket will be counted as resolved during the reporting period if the last user response was sent during that time.
Resolution Time: The time it took from ticket creation to the time when the last user response was sent that resolved the ticket. If a customer reopens a ticket by replying to say "Thanks" or by replying to an old ticket with a new question (which is then split into a new ticket), the resolution time is not affected.
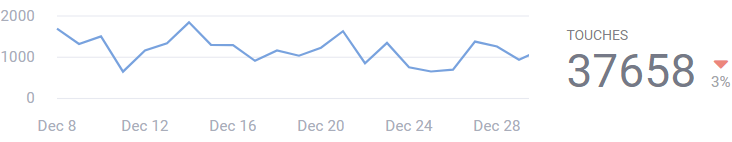
Touches: Each touch represents any kind of "change" done to the ticket: state change, assignment, adding/removing label, etc.
Notes:
Reports count a ticket as closed or resolved only on the last time it's closed or resolved.
Closed tickets vs Resolved Tickets: Closed tickets include things which you didn't respond to (like automated emails).. but resolved tickets count tickets that your team has actually replied to.
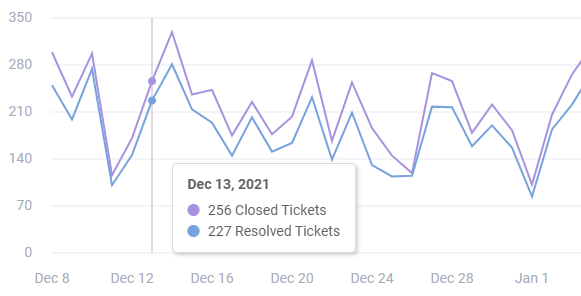
This gives you an overview of the teams productivity. The line char shows the number of tickets that were closed (in purple), and the number of tickets that were resolved (in blue). When you hover over a point the chart show you the actual numbers for that time.
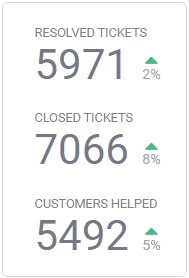
To the right of the chart, you can see total numbers and comparisons to the last time period for:
Resolved tickets
Closed tickets
Customer helped
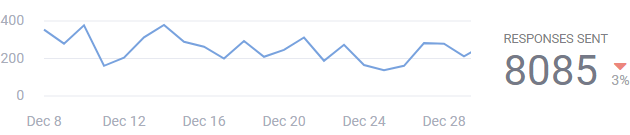
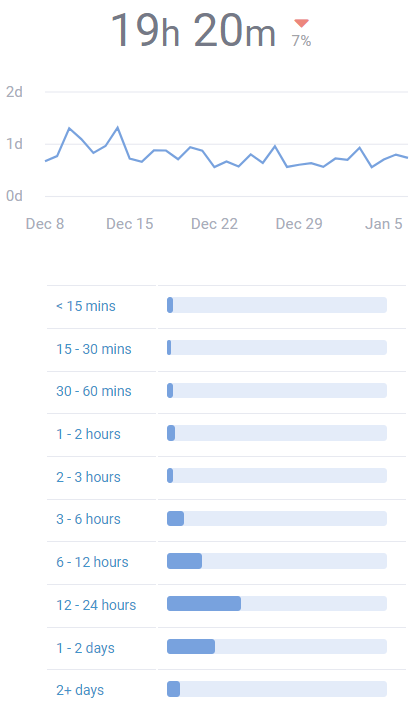
This section shows you how many responses were written over time. The total response count and a comparison to the last period is also shown next to the chart.
The next two charts in this section represent the response time distribution. How much time the responses took on average and a breakdown of what percentage was in each time range. You see the same breakdown for first responses in the second chart (to the right).
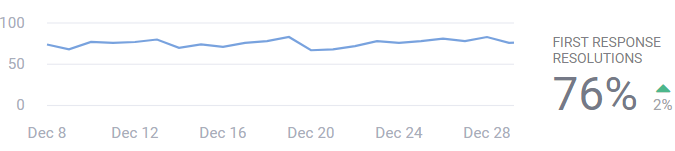
Here you can see the the number of tickets that were resolved over time. It also shows you how many percent of those tickets were resolved at the first reply.
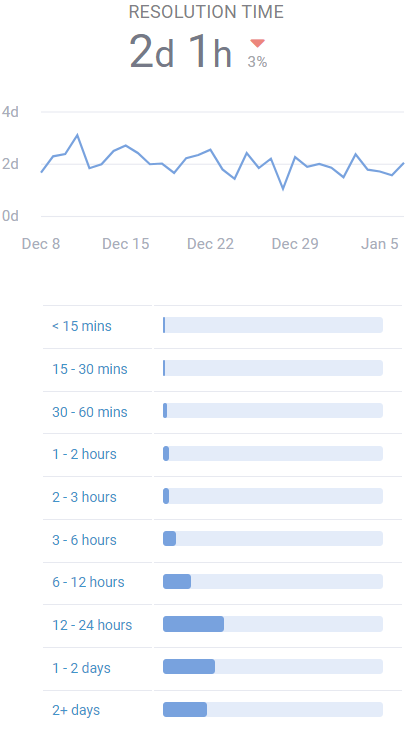
Resolution Time: The following section shows how long did it takes your team to resolve the tickets over time. It also has a breakdown of percentage of tickets resolved in each time range.
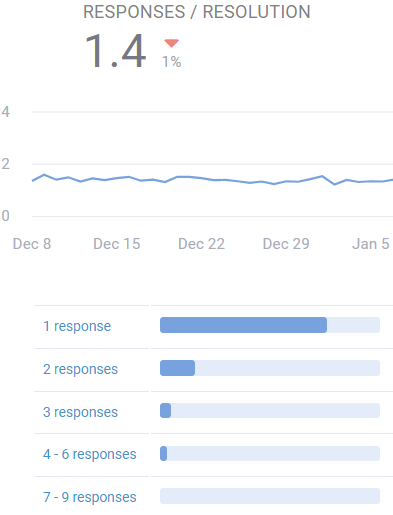
Responses per Resolution: You can also see a breakdown of how many responses did it take on average for your team to resolve an issue. This can give you insights on whether there's room for improvements if you see your team sending more responses per resolution than expected.
Measuring team performance can't be complete without looking at how the customers feel about it. The overview section of the Happiness Report is shown here to give you a summary of customers' experience. A link to the full happiness report is also shown at the bottom right of the section, in case you want to dig in further.
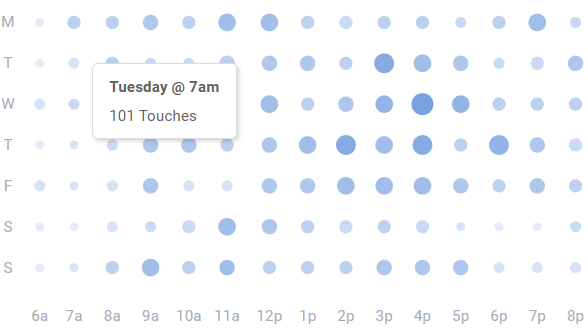
This section combines writing responses with the rest of the work that your team does behind the scenes. This includes all the changes that a user made to the tickets: changing state, adding/removing labels, writing notes, assigning the ticket etc.
The time-of-day chart shows when you're team is the getting all the work done. The more work the team is doing at a particular time of the day, the bigger and darker the circle will be on the chart. You can also hover on a certain time and day to see how much activity was going on at that time.