Ticket Report
This report shows you how much volume of requests have you received during the reporting period, when is your team the busiest, how your customers contacted you, and what are the most common issues. It also provides a glance of what workflows your team is running through most often.
This is good place for monitoring the overall health of the operations, identify any kind of out of norm incidents and, more generally detecting trends in your support operations.
Let's look at each section in detail.
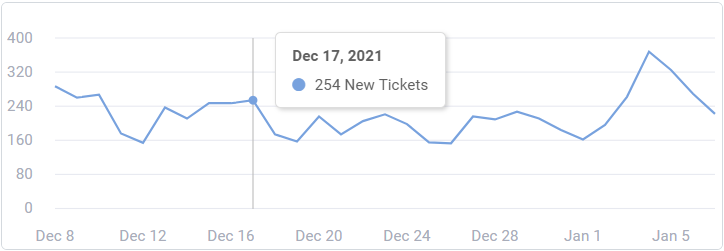
The volume section shows an interactive chart of how many requests you received each day. You can hover over any point to see how big a promotion related spike was or check to make sure the dips were the usual slow days due to weekends.
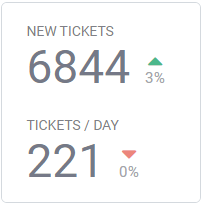
To the right of the chart, a summary of the numbers is also available.
New tickets: total number of new tickets in the selected time period, followed by a percentage change from the last time period (in this example, there was a 3% increase in ticket volume this month when compared to last month).
Average number of tickets per day: It shows the average number of tickets received per day, followed by the percentage change from last time. (here, there was 0% change so the average didn't change).
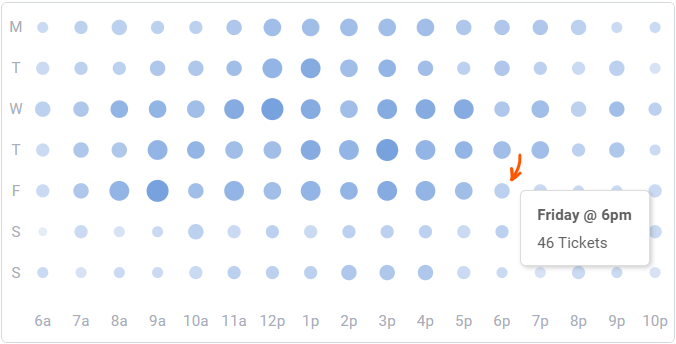
The busiest times chart shows time in the time zone configured in your user settings. When you hover on a point in the chart, it shows you the time and how many tickers were received at that hour of the day. The higher the ticket volume, the bigger and darker the circle on that time of the day will be.
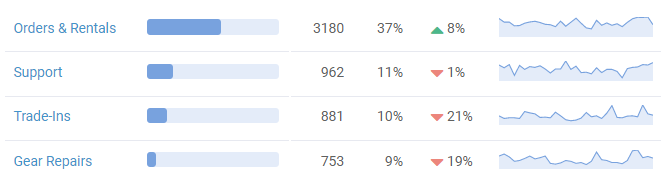
The rest of the sections in this report share the type of metrics that are shown. Let's take a look at what data is shown in each of the columns:
Name of the Item (label, canned response, macro, rule, channel type etc)
how many times it was added to the tickets (or used on tickets)
percentage of it's usage against the rest of the items
a comparison from the pervious period
a line chart of usage over the time period
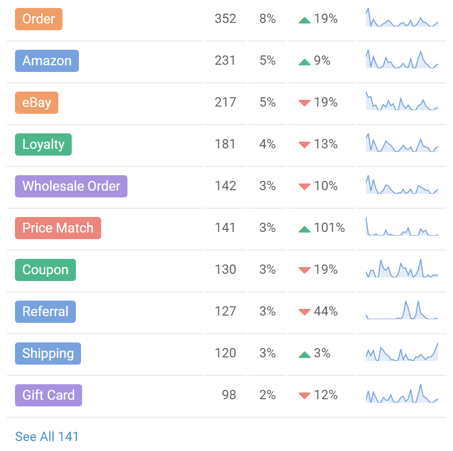
The label breakdown shows which labels were added to the tickets during the reporting period. Label usage is counted even if the label is later removed and is no longer on the ticket. Top 10 labels are shown by default, and you can click on the See All link at the bottom left of the section to see the rest of them.
Pro Tip: You can click on a label here to drill down to see which tickets was it added to.
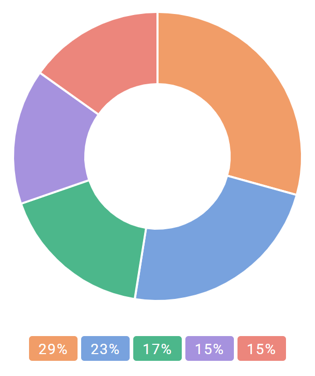
This section also shows a color distribution wheel. If you're set up your labels in a way that colors represent something meaningful (for example: green represents inquiry, and orange means issue with orders), then you can see the ratios of how these compare to one another.
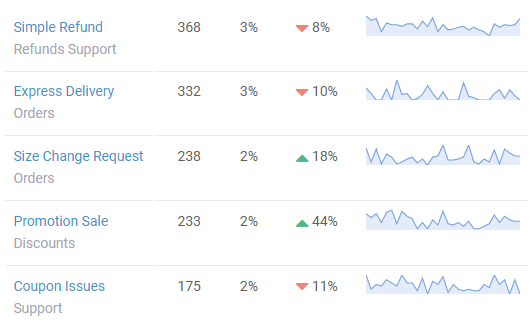
This section shows the canned responses that were used while replying or adding notes to the tickets during the reporting period. Top 10 are shown by default, and you can click on the See All link at the bottom left of the section to see the rest of them.
Pro Tip: You can click on a canned response here to drill down to see which tickets was it used on.
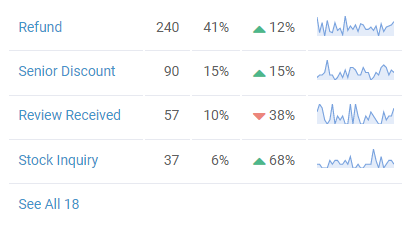
These two sections show rules and macros that were run on the tickets during the reporting period. Top 10 are shown by default, and you can click on the See All link at the bottom left of the section to see the rest of them.
Pro Tip: You can click on a rule or a macro here to drill down to see which tickets was it run on.
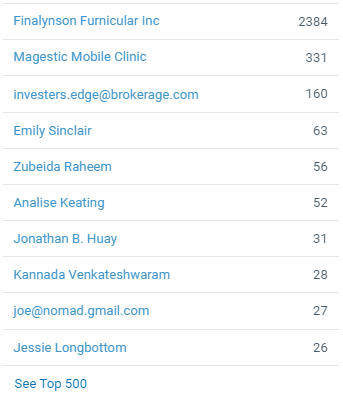
The customer breakdown shows which customers are the most popular. If the customer on a ticket is changed, both customers are counted. This might be handy for businesses that have few high profile customers or who's customers are other big businesses.
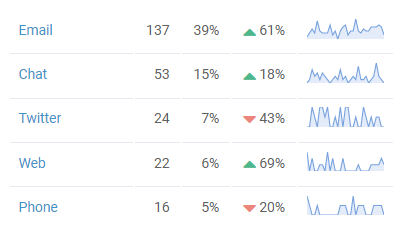
The channel type breakdown shows what channels the customers have used to reach out in the reporting period.
Pro Tip: You can click on a channel type here to drill down to see which tickets came through this channel.
The inbox breakdown shows which inboxes tickets were associated with. If a ticket is moved to another inbox, both inboxes are counted.